BIKZ.DEV — INTERNATIONAL CASE No. 11 MIAMI CONDO ANALYTICS · 2025 NEXT.JS + LARAVEL · GOV-DATA INGESTION · GOOGLE MAPS USA · MIAMI, FL · LIVE AT MIAMICONDOANALYTICS.COM +7 775 878 17 32 BIKZ.DEV — INTERNATIONAL CASE No. 11 MIAMI CONDO ANALYTICS · 2025
Case · No. 11
2025
Web · Next.js + Laravel
USA · INTERNATIONAL

MIAMI
CONDO
ANALYTICS.

A research tool for Miami real-estate professionals to present building-level performance data to buyers and sellers — five-year appreciation, median price per square foot, real growth trajectories — pulled from government property records, normalised, and surfaced through a fast Next.js front-end with a full Google Maps experience and a Laravel back-office for editorial curation.

Real-estate analytics Web · Map · Data 2025
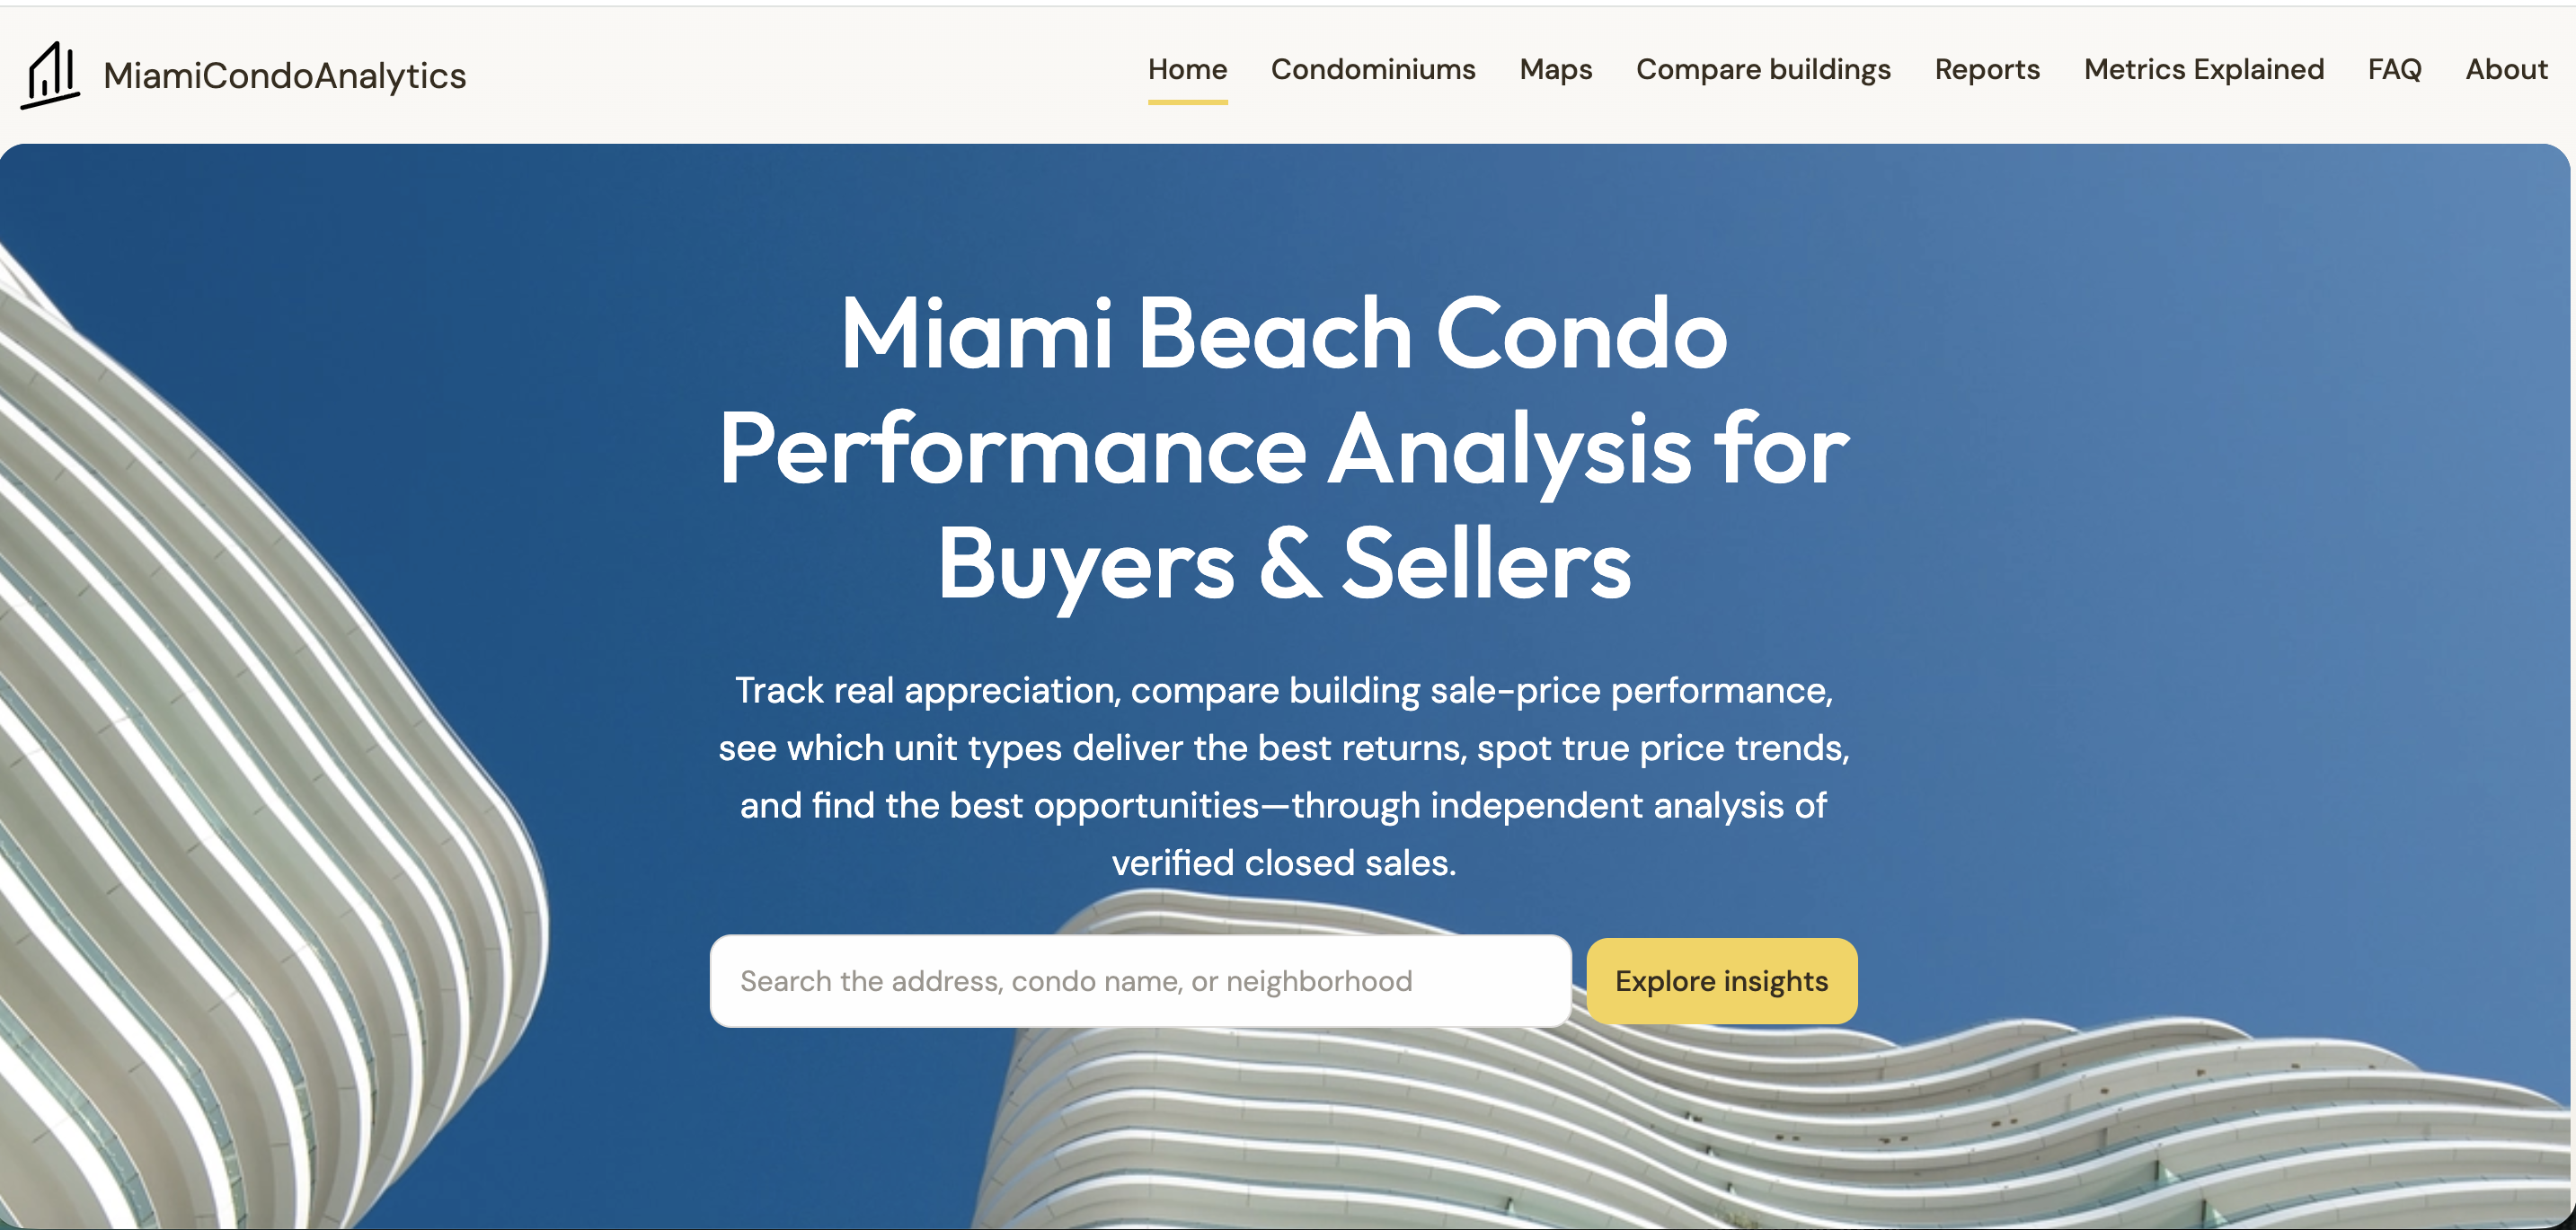
Miami Condo Analytics home — ‘Miami Beach Condo Performance Analysis for Buyers & Sellers’ headline over a curved white modern condo silhouette, with a search bar and an Explore Insights CTA
Year
2025
Length
10 wk
Scale
150+ buildings
Status
Live
01

About the project

// 3 min read

A buyer in Miami looking at a $2M condo wants the same answer a stock buyer wants: how has this asset performed, and how does that compare to the alternatives on the same street. The listing portals don't surface that — they surface marketing. Our client, a Miami real-estate professional, asked for the opposite: a research-grade web app that takes verified closed sales from public records, rolls them up to the building level, and gives a realtor a defensible answer to "should I buy here." We shipped it as miamicondoanalytics.com.

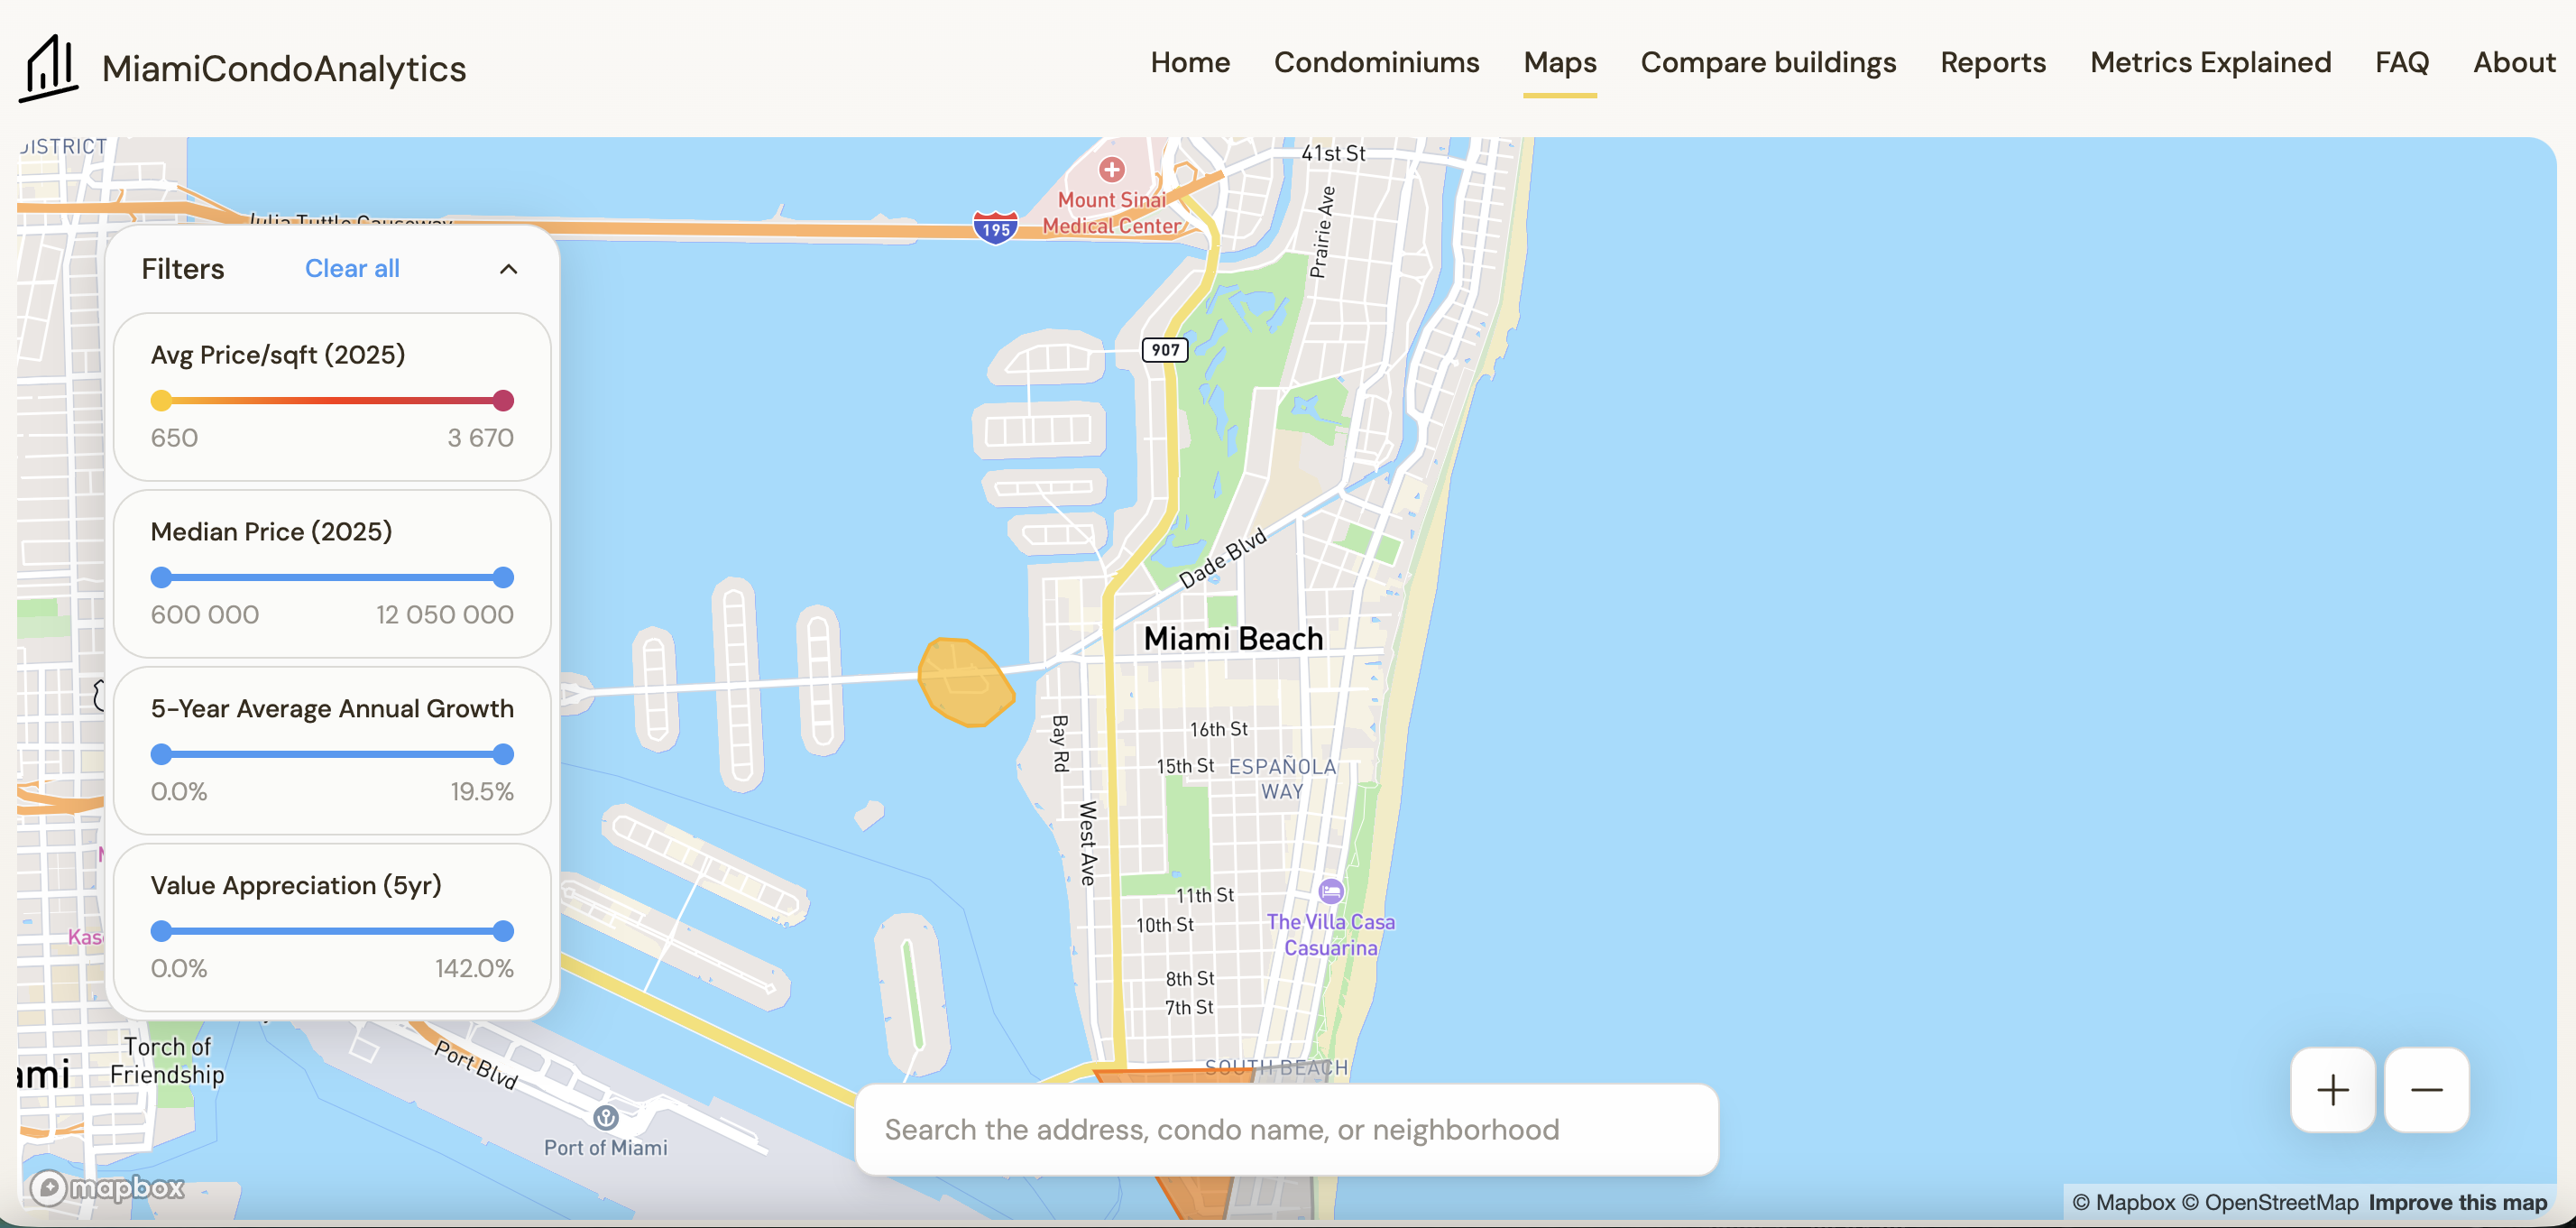
Miami Condo Analytics map view — interactive map of Miami Beach with a left-side filter panel (Avg price/sqft 2025, Median price 2025, 5-year average annual growth, Value appreciation 5yr) and a search bar overlaying the map
01Map view — Google Maps with appreciation, growth and price filters across every tracked building

The numbers are real because the source is. We ingest from government property records — the Miami-Dade County Property Appraiser's parcel and sales feeds, the Miami-Dade Recorder of Deeds for arms-length transfers, the Florida Department of Revenue's certified valuation data, and US Census ACS for neighbourhood context — into a Laravel pipeline that geocodes, deduplicates, classifies arms-length vs. non-arms-length, and reduces every transaction to a square-foot basis. From those we derive what the front end shows: median price per sqft per year, annualised five-year growth per building, percentile bands across the street and neighbourhood, and the appreciation a unit of a given size and floor would have realised had it been bought five years ago and sold today.

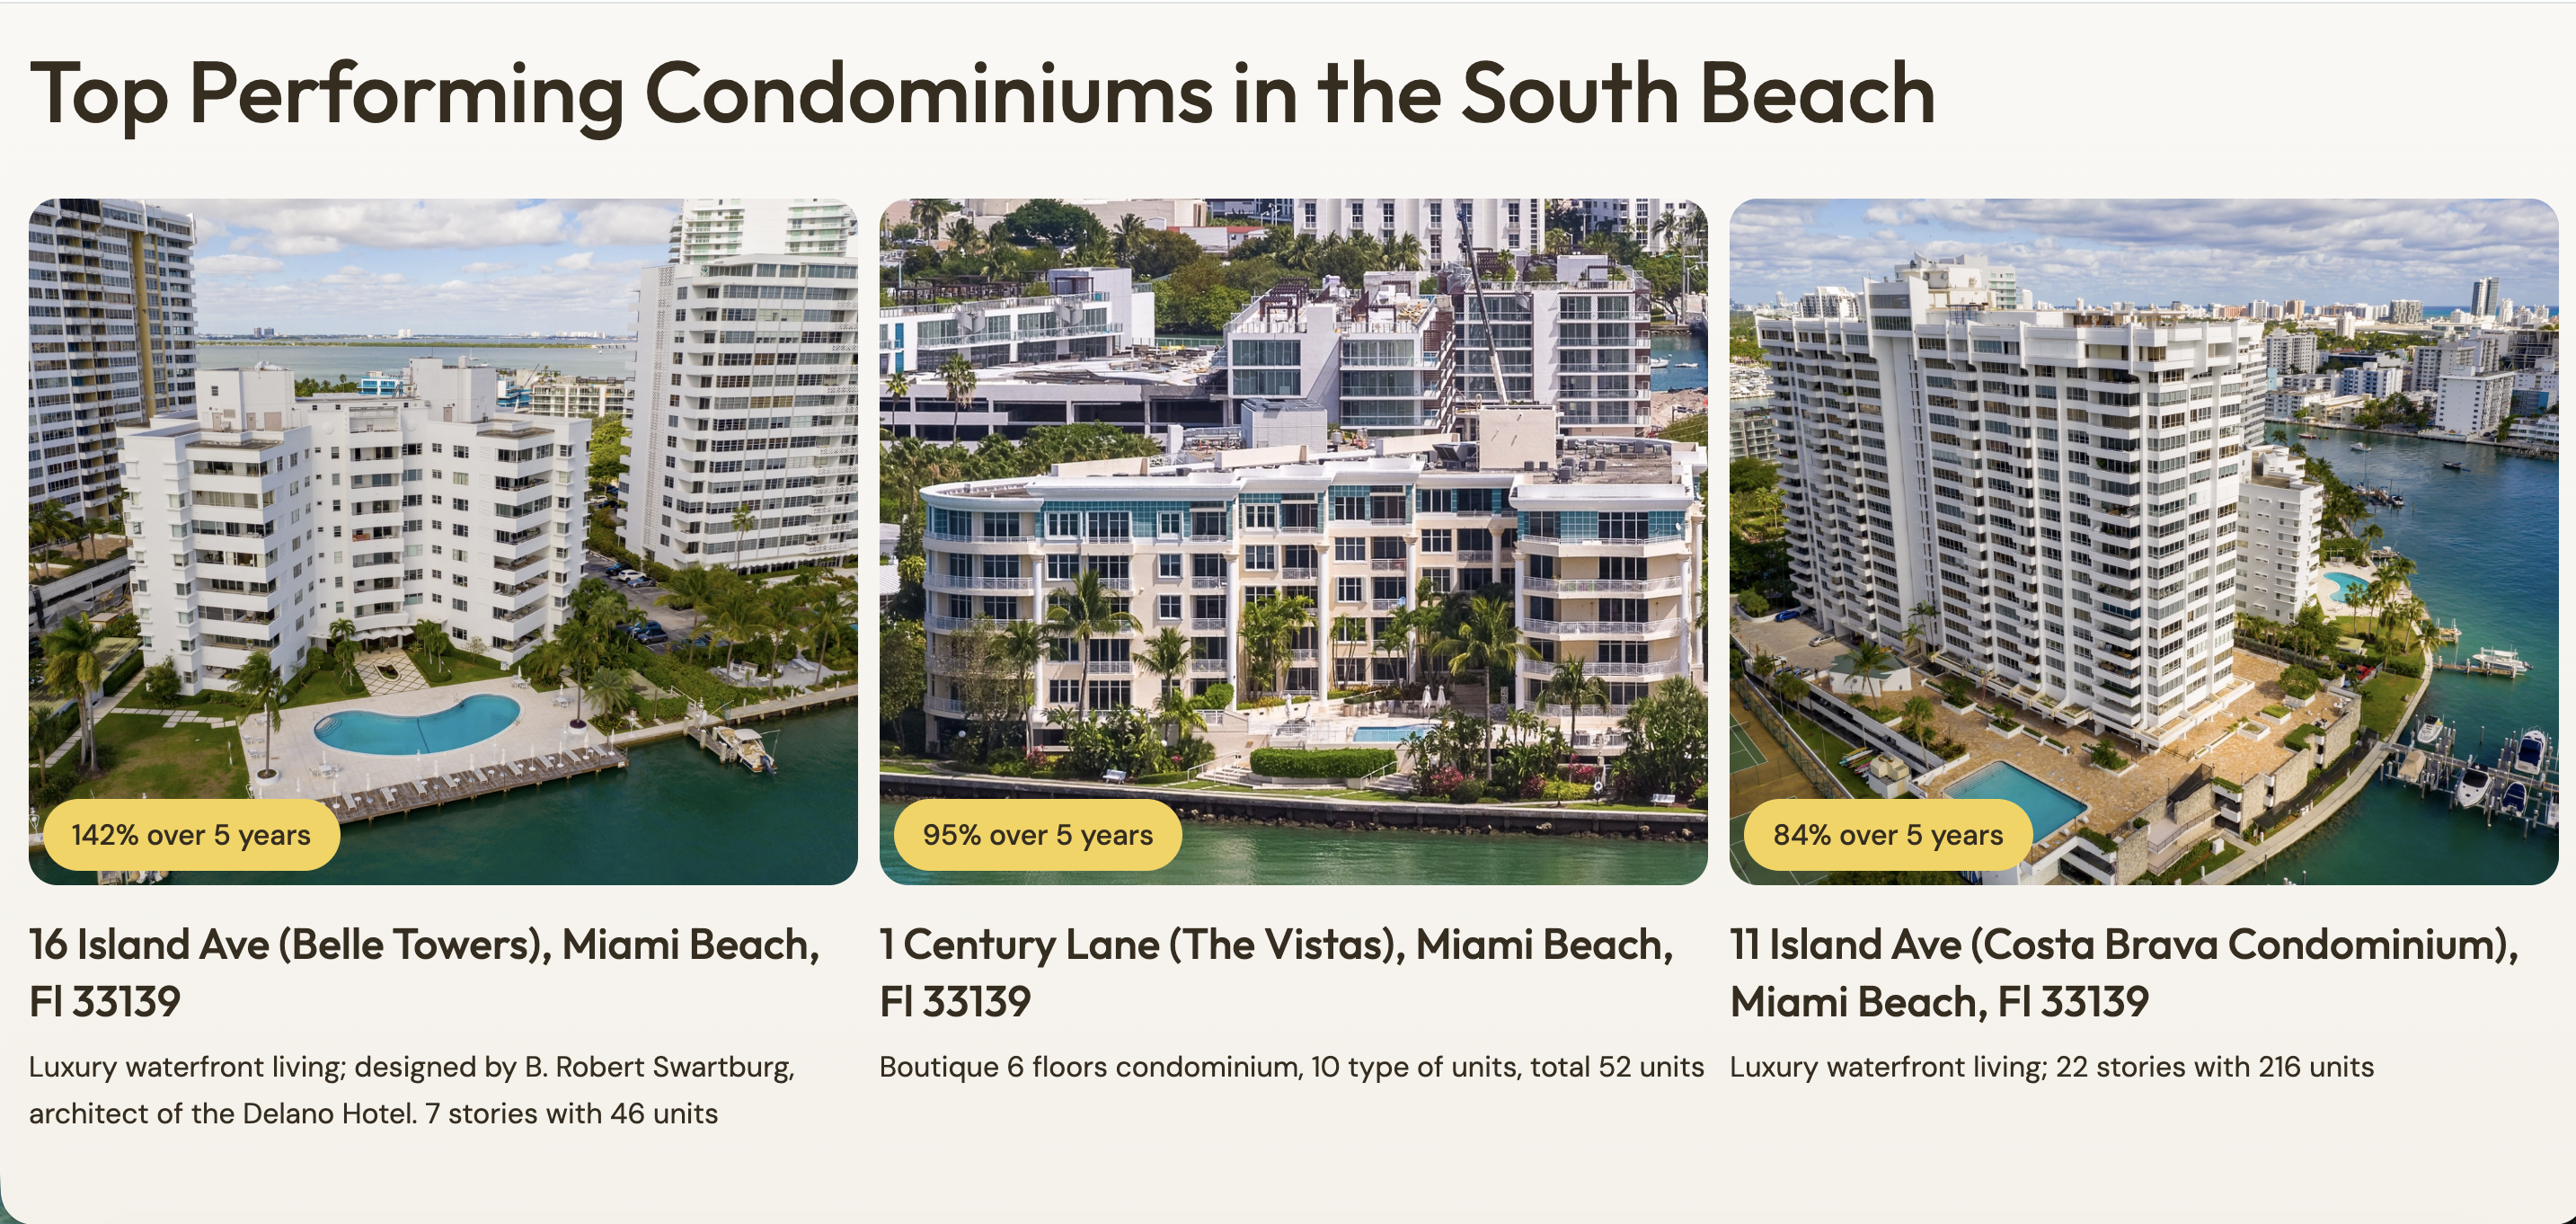
Top Performing Condominiums in the South Beach — three card grid showing aerial photos of waterfront condo buildings with five-year appreciation badges (142%, 95%, 84%) and unit-count, floor-count, type metadata
02Top performers — every building ranked, every percentage backed by closed-sale data

The Google Maps integration is what turns the database into a tool. Every tracked building is a marker; the left-rail filters re-paint the map in real time as the user narrows by avg price per sqft, median price, five-year growth, or value appreciation; address search uses Google's Place Autocomplete so a buyer can type a half-remembered address and land on the right pin; click any marker and the side panel opens the building's full record — sale history, unit-mix breakdown, price-per-sqft trajectory, comparable buildings within walking distance. The map is the index; the building pages are the deep dives.

The front end is a Next.js 14 app — server components for the SEO-heavy building pages, client islands for the map and the comparison tools, ISR on the rolled-up neighbourhood reports so a fresh transaction in the public records appears on the site within the hour. The Laravel admin is where the operator lives: ingestion job dashboards, the manual reclassification UI for transactions the heuristics aren't sure about, the editorial layer that adds building photography and architect notes, and the report builder that emits the PDF a realtor hands a client at the kitchen table. Every public number on the site is one click away from the underlying transactions in the admin — there is no "magic," just verifiable closed sales rolled up clearly.

02

Stack

// what we shipped on
Next.js 14 React TypeScript Tailwind Laravel PHP 8 PostgreSQL Redis Google Maps Place Autocomplete MDC Property Appraiser MDC Recorder of Deeds FL Dept of Revenue US Census ACS Vercel Cloudflare
Next · Flagship · No. 12 · 2026

CODE.DALA.

← Previous: Jas Tarlan